Reporting & Analytics
Release notes
Release notes
v0.5.5 Reporting & Analytics
Added: Home dashboard with operational activity overview
Added: New Reports section in the sidebar navigation
Added: General reports with pipeline and quoting analytics
Added: Client analytics reports and revenue rankings
Added: Quote performance reporting with conversion tracking
Added: Orders reporting with fulfillment and backlog metrics
Added: Batch production reporting with defect rate and processing metrics
Added: Client page analytics widgets with quote, order, revenue and production metrics
Reporting & Analytics: Home Dashboard,
Reports & Client Insights
A new reporting experience across the platform.
giving teams a clearer picture of quotes, orders, production activity, and client performance.
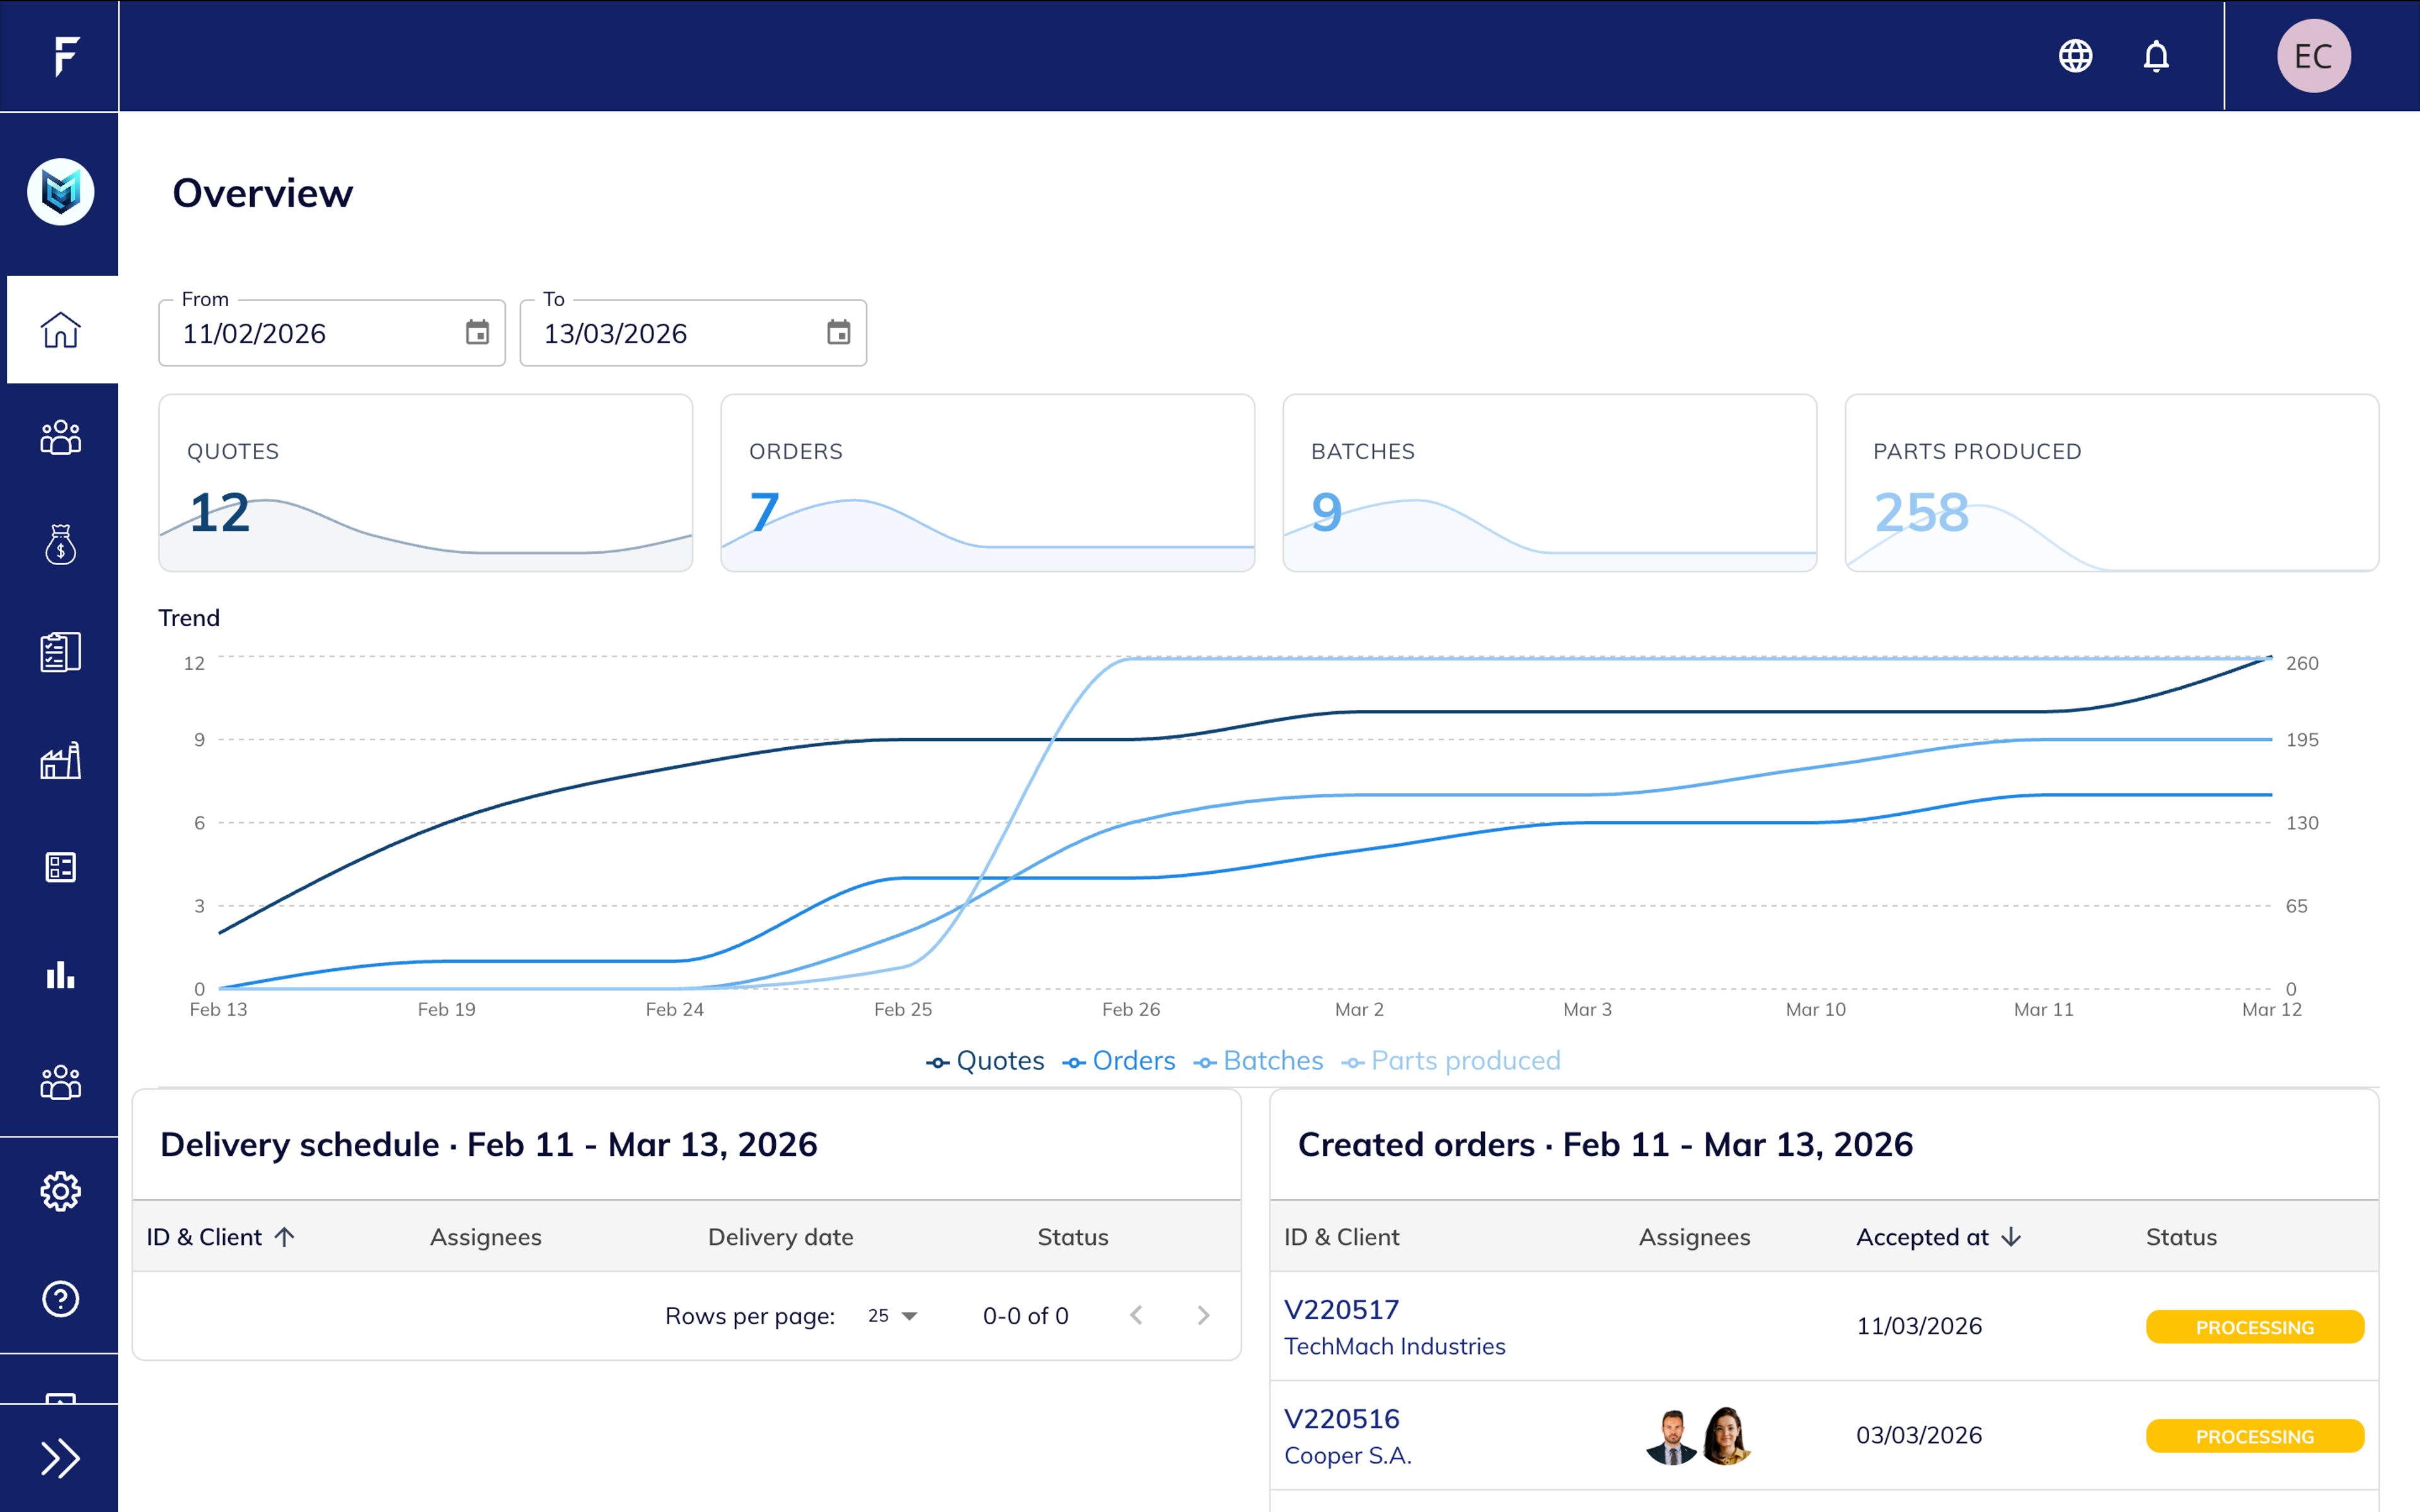
Operational Overview at a Glance
The new Home dashboard gives you a quick snapshot of platform activity.
Track the most important operational metrics in one place, including quotes created, orders accepted, batches created, and parts produced.
A visual trend chart helps monitor activity over time, while delivery schedules and recent orders provide quick access to ongoing work.
Key improvements:
- Quick overview of quoting and production activity
- Trend visualization across quotes, orders, batches and parts
- Delivery schedule and recent order activity on the same screen
A Dedicated Space for Analytics
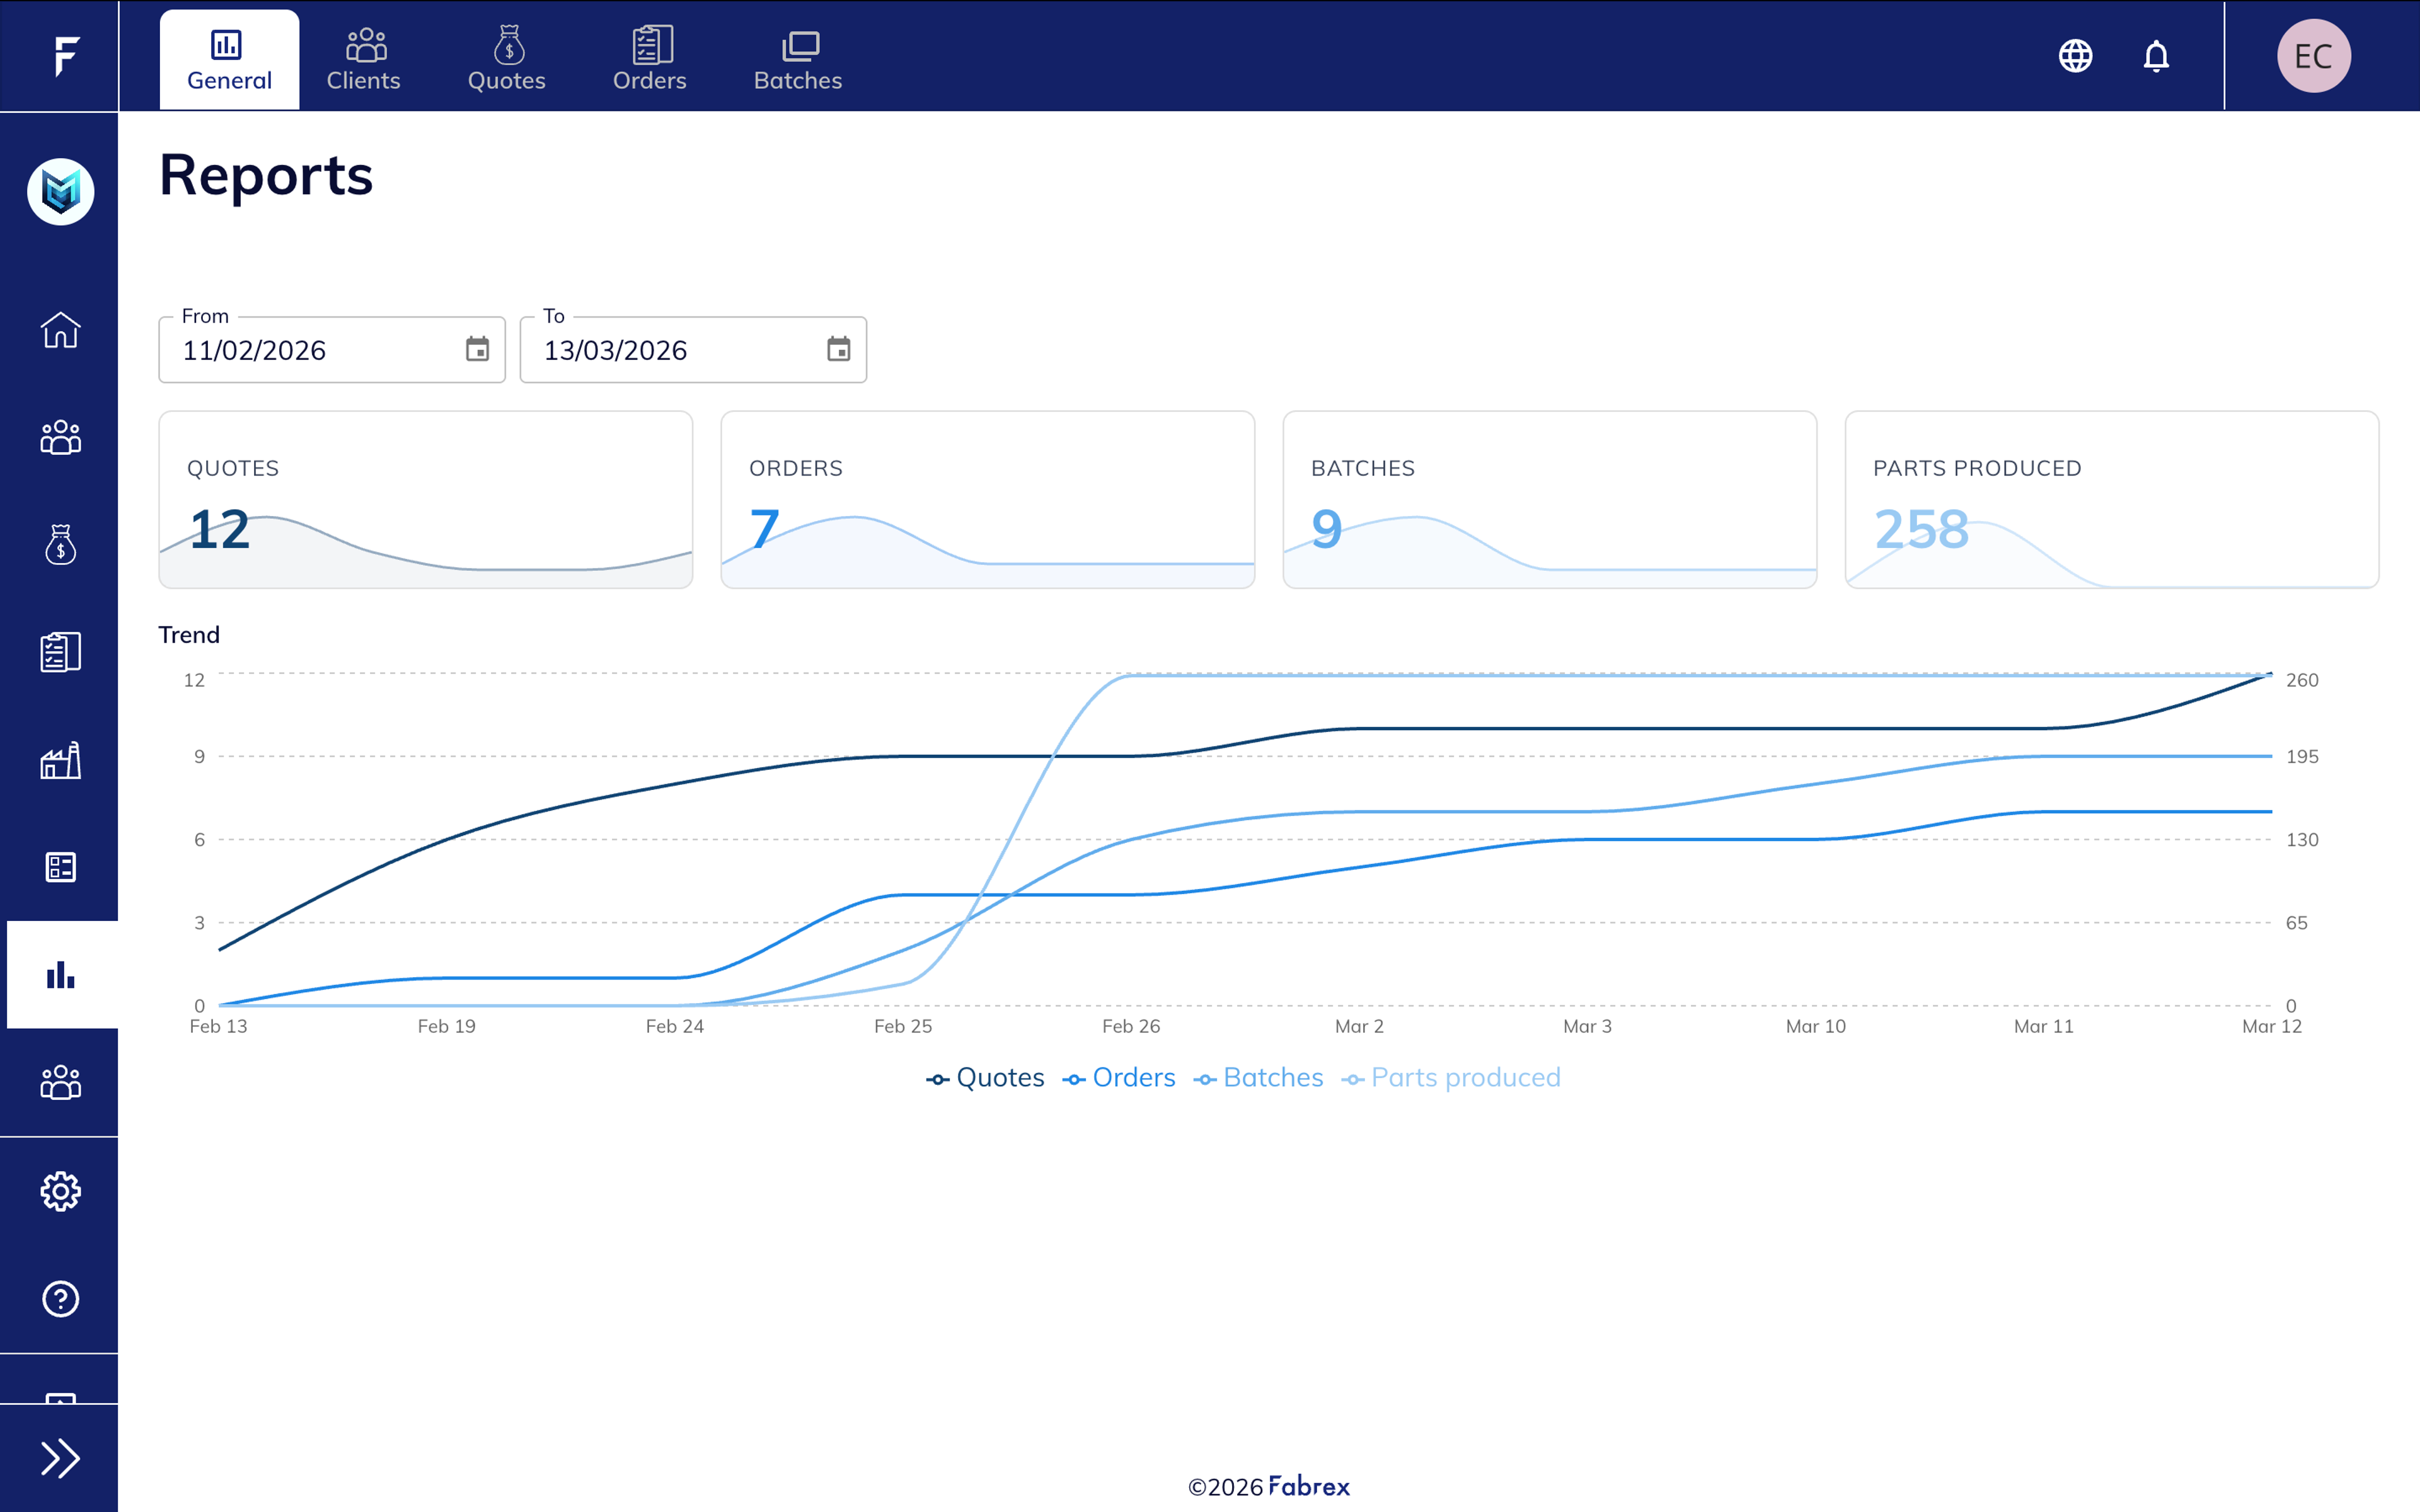
Sales and Pipeline Performance
The General report provides an overview of quoting and sales activity.
It includes key metrics such as total quotes, orders, conversion rate, average order value, and pipeline value.
Charts help visualize activity trends and compare current and previous periods, making it easier to understand how quoting performance evolves over time.
Highlights include:
- Quote and order trends
- Conversion rate analysis
- Pipeline value overview
- Period comparison charts
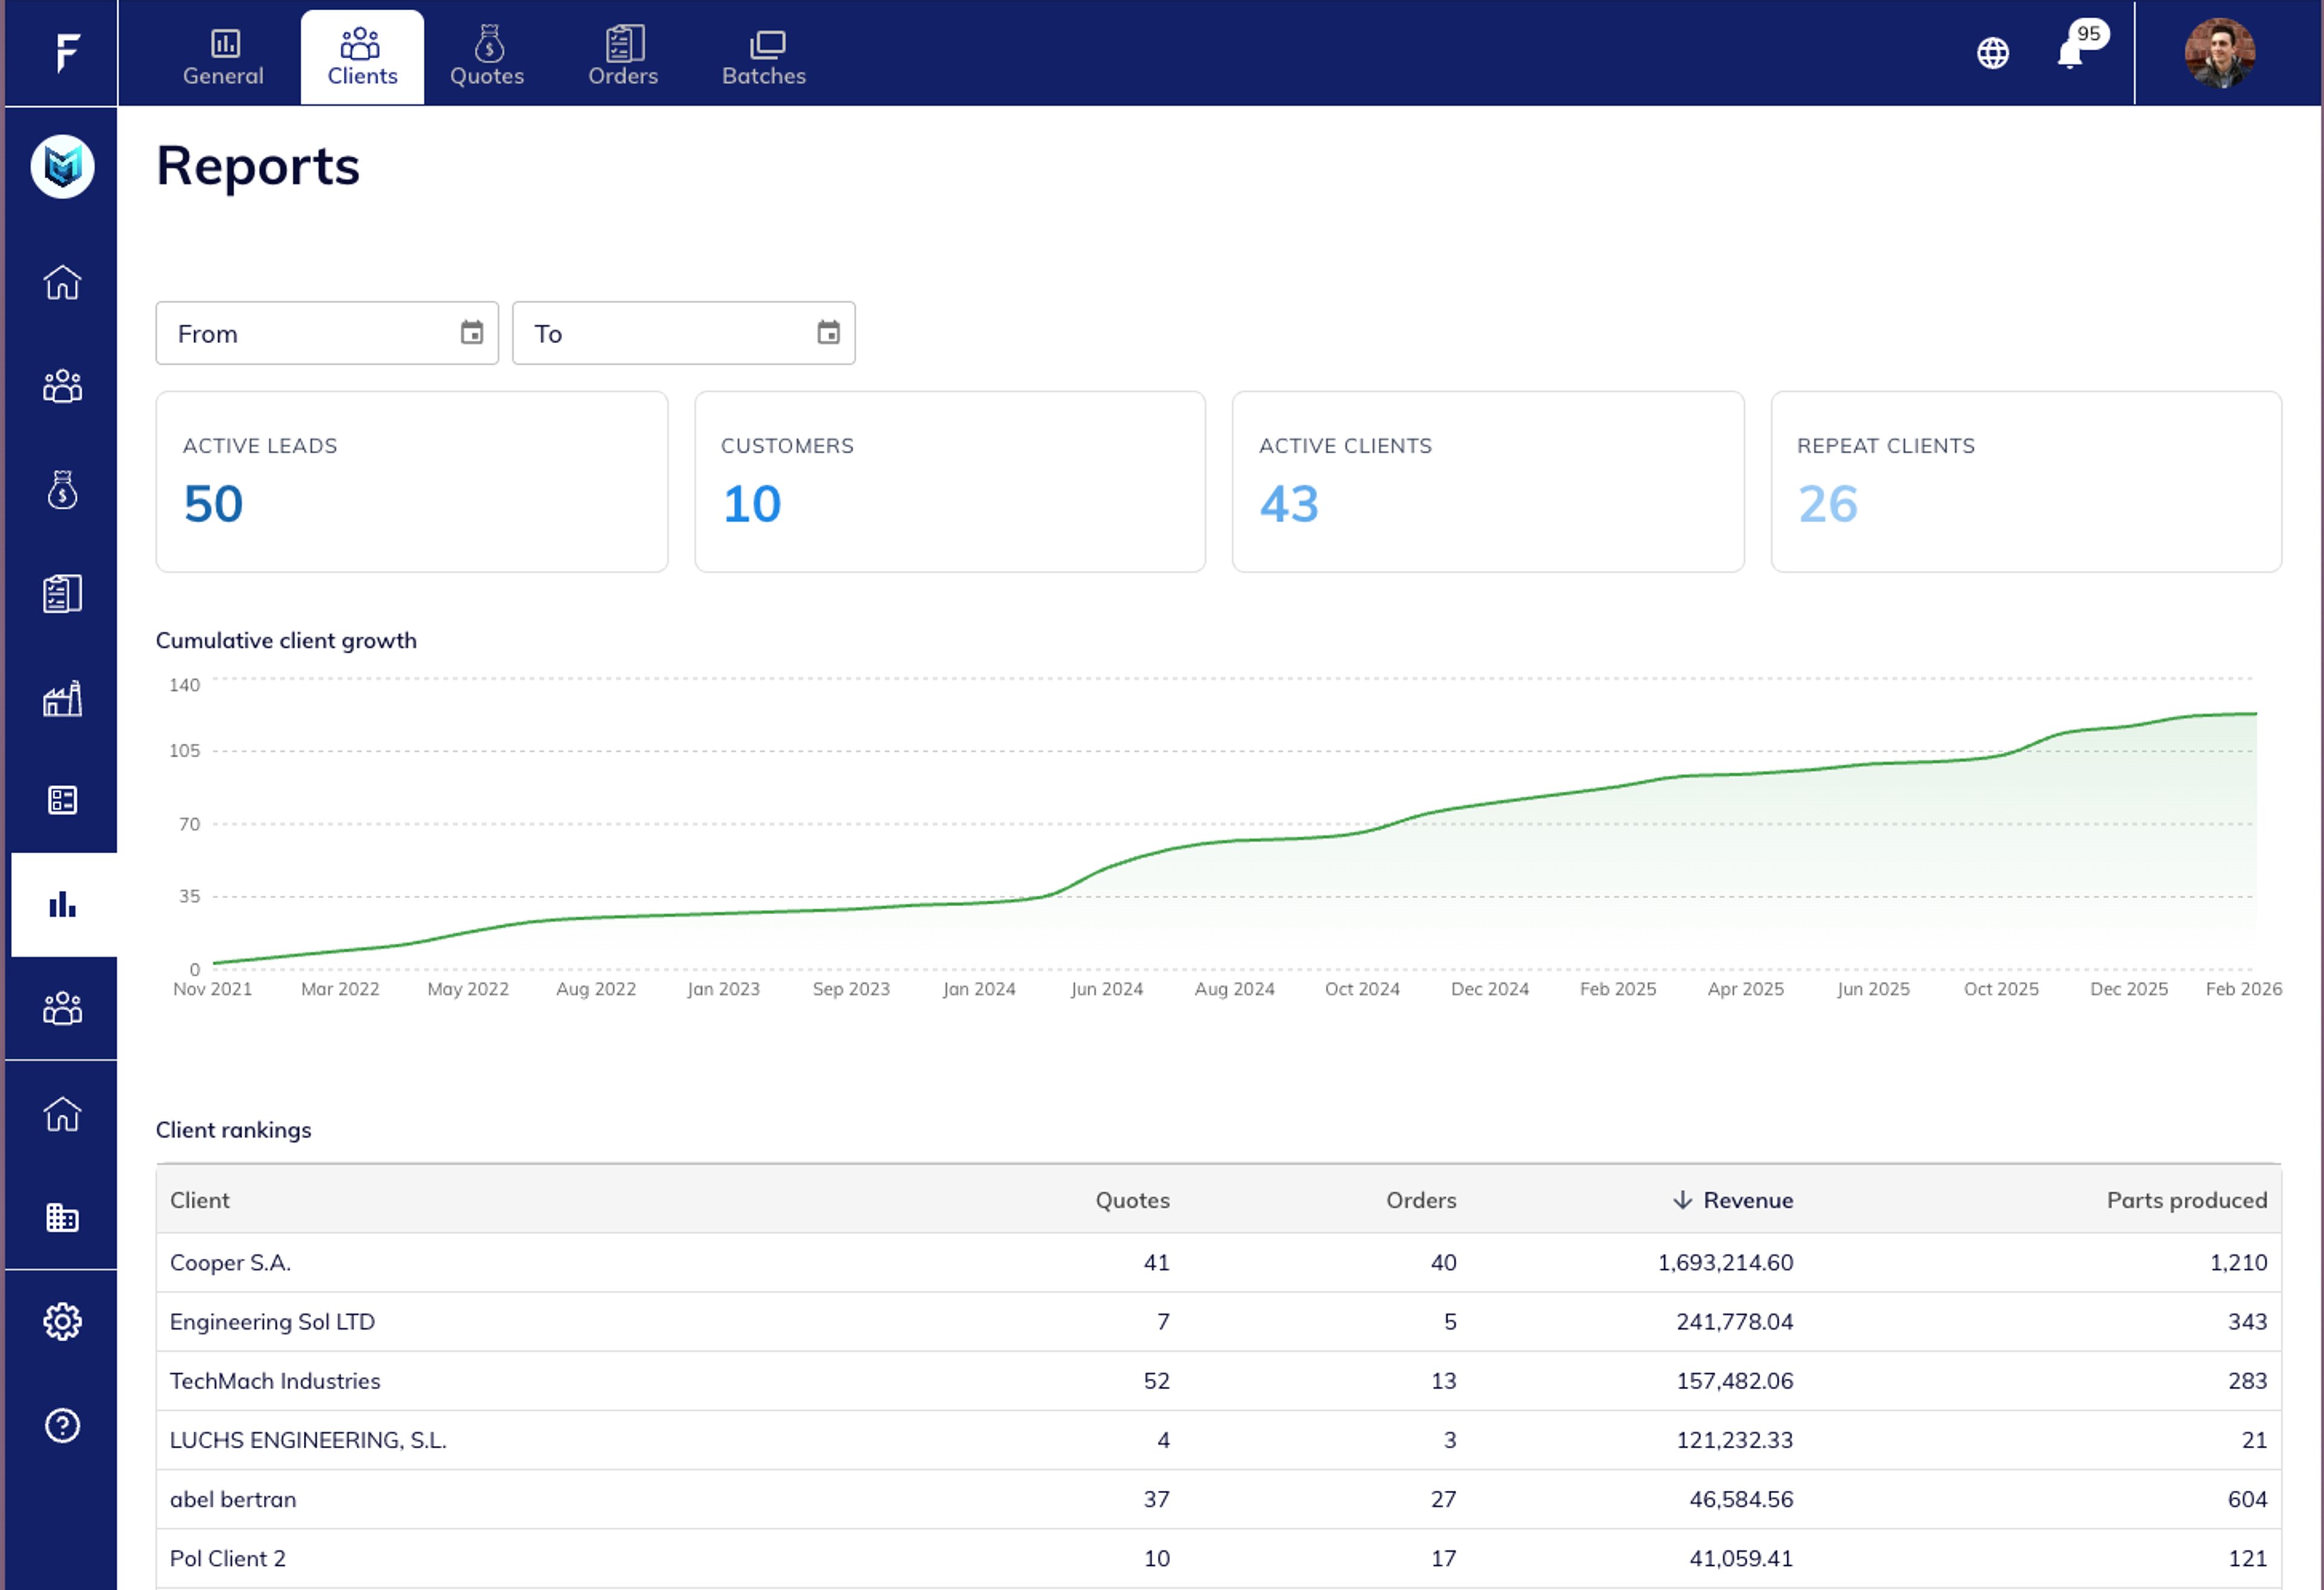
Client Growth and Revenue Insights
The Clients report focuses on customer activity and revenue contribution.
It provides visibility into client growth, active clients, repeat customers, and revenue distribution.
You can also see client rankings, helping identify your most valuable customers.
Key insights include:
- Active clients and repeat customers
- Client growth over time
- Revenue contribution per client
- Quote and order activity by client
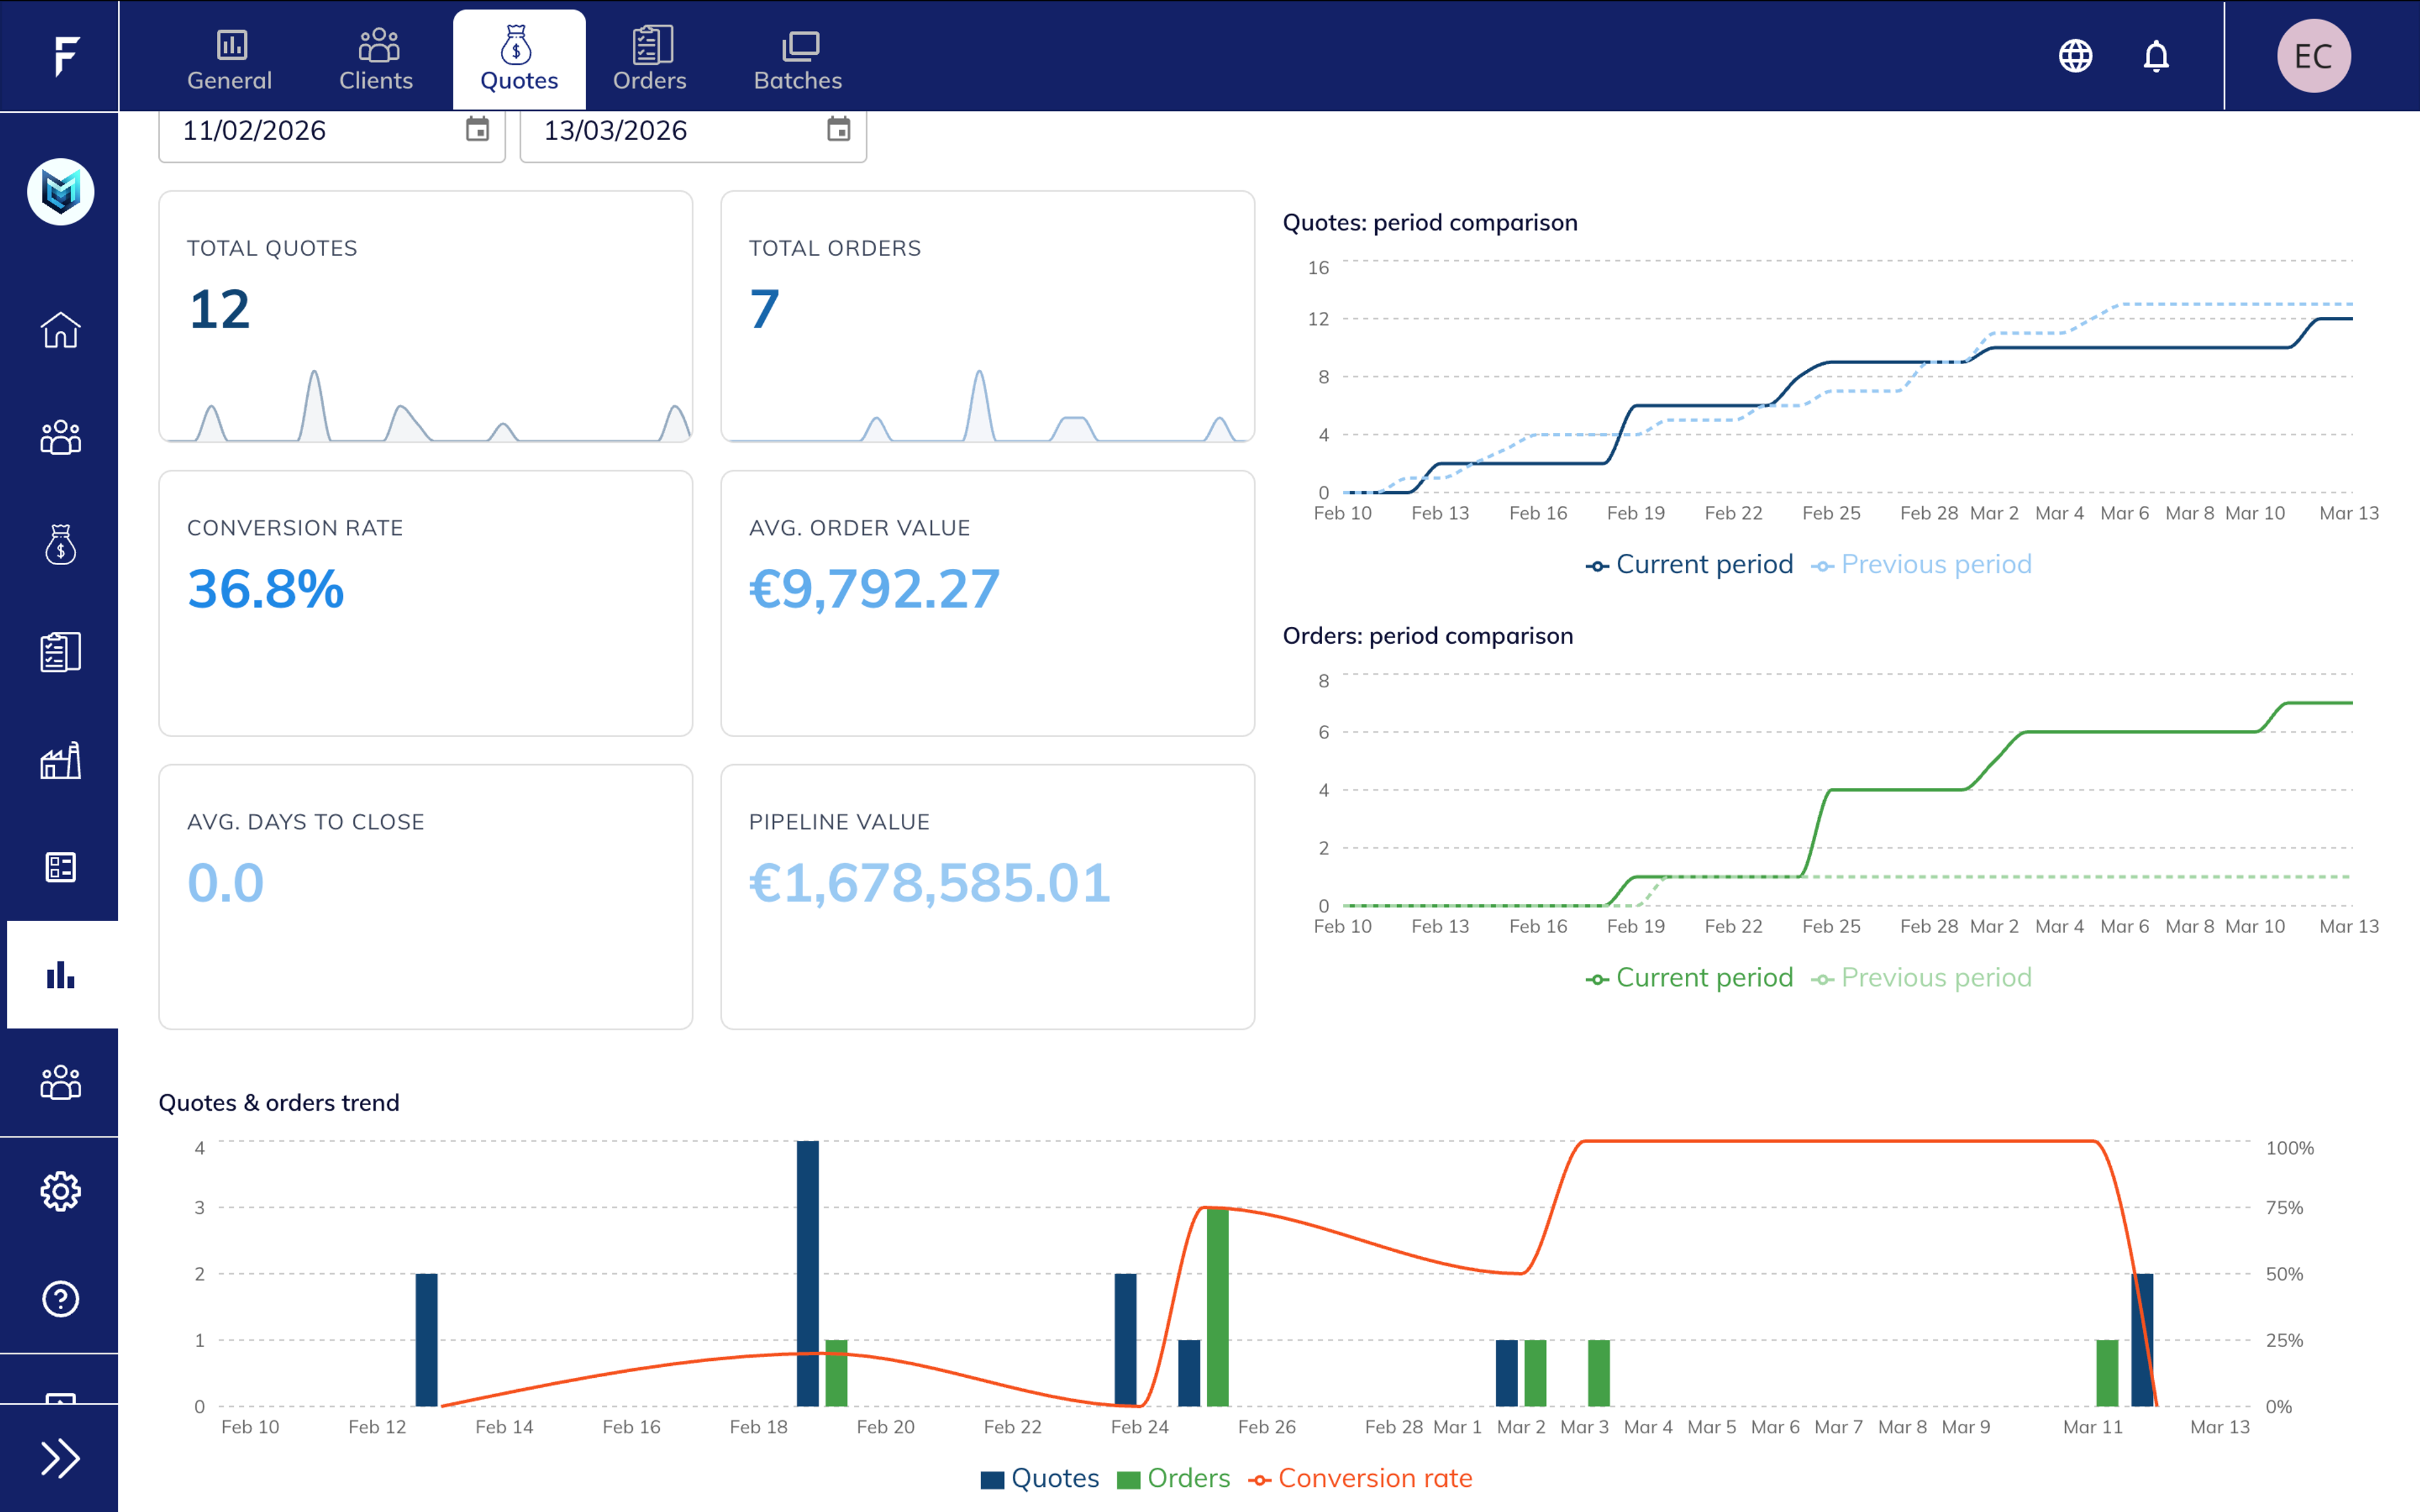
Quote Performance Analysis
The Quotes report focuses on quoting activity and sales performance.
It helps teams understand how quotes evolve into orders and track key indicators such as conversion rate, average order value, and pipeline value.
Charts show quote trends, order conversion, and period comparisons to help evaluate quoting efficiency.
Highlights include:
- Quote and order trend analysis
- Conversion rate monitoring
- Average order value tracking
- Pipeline value visibility
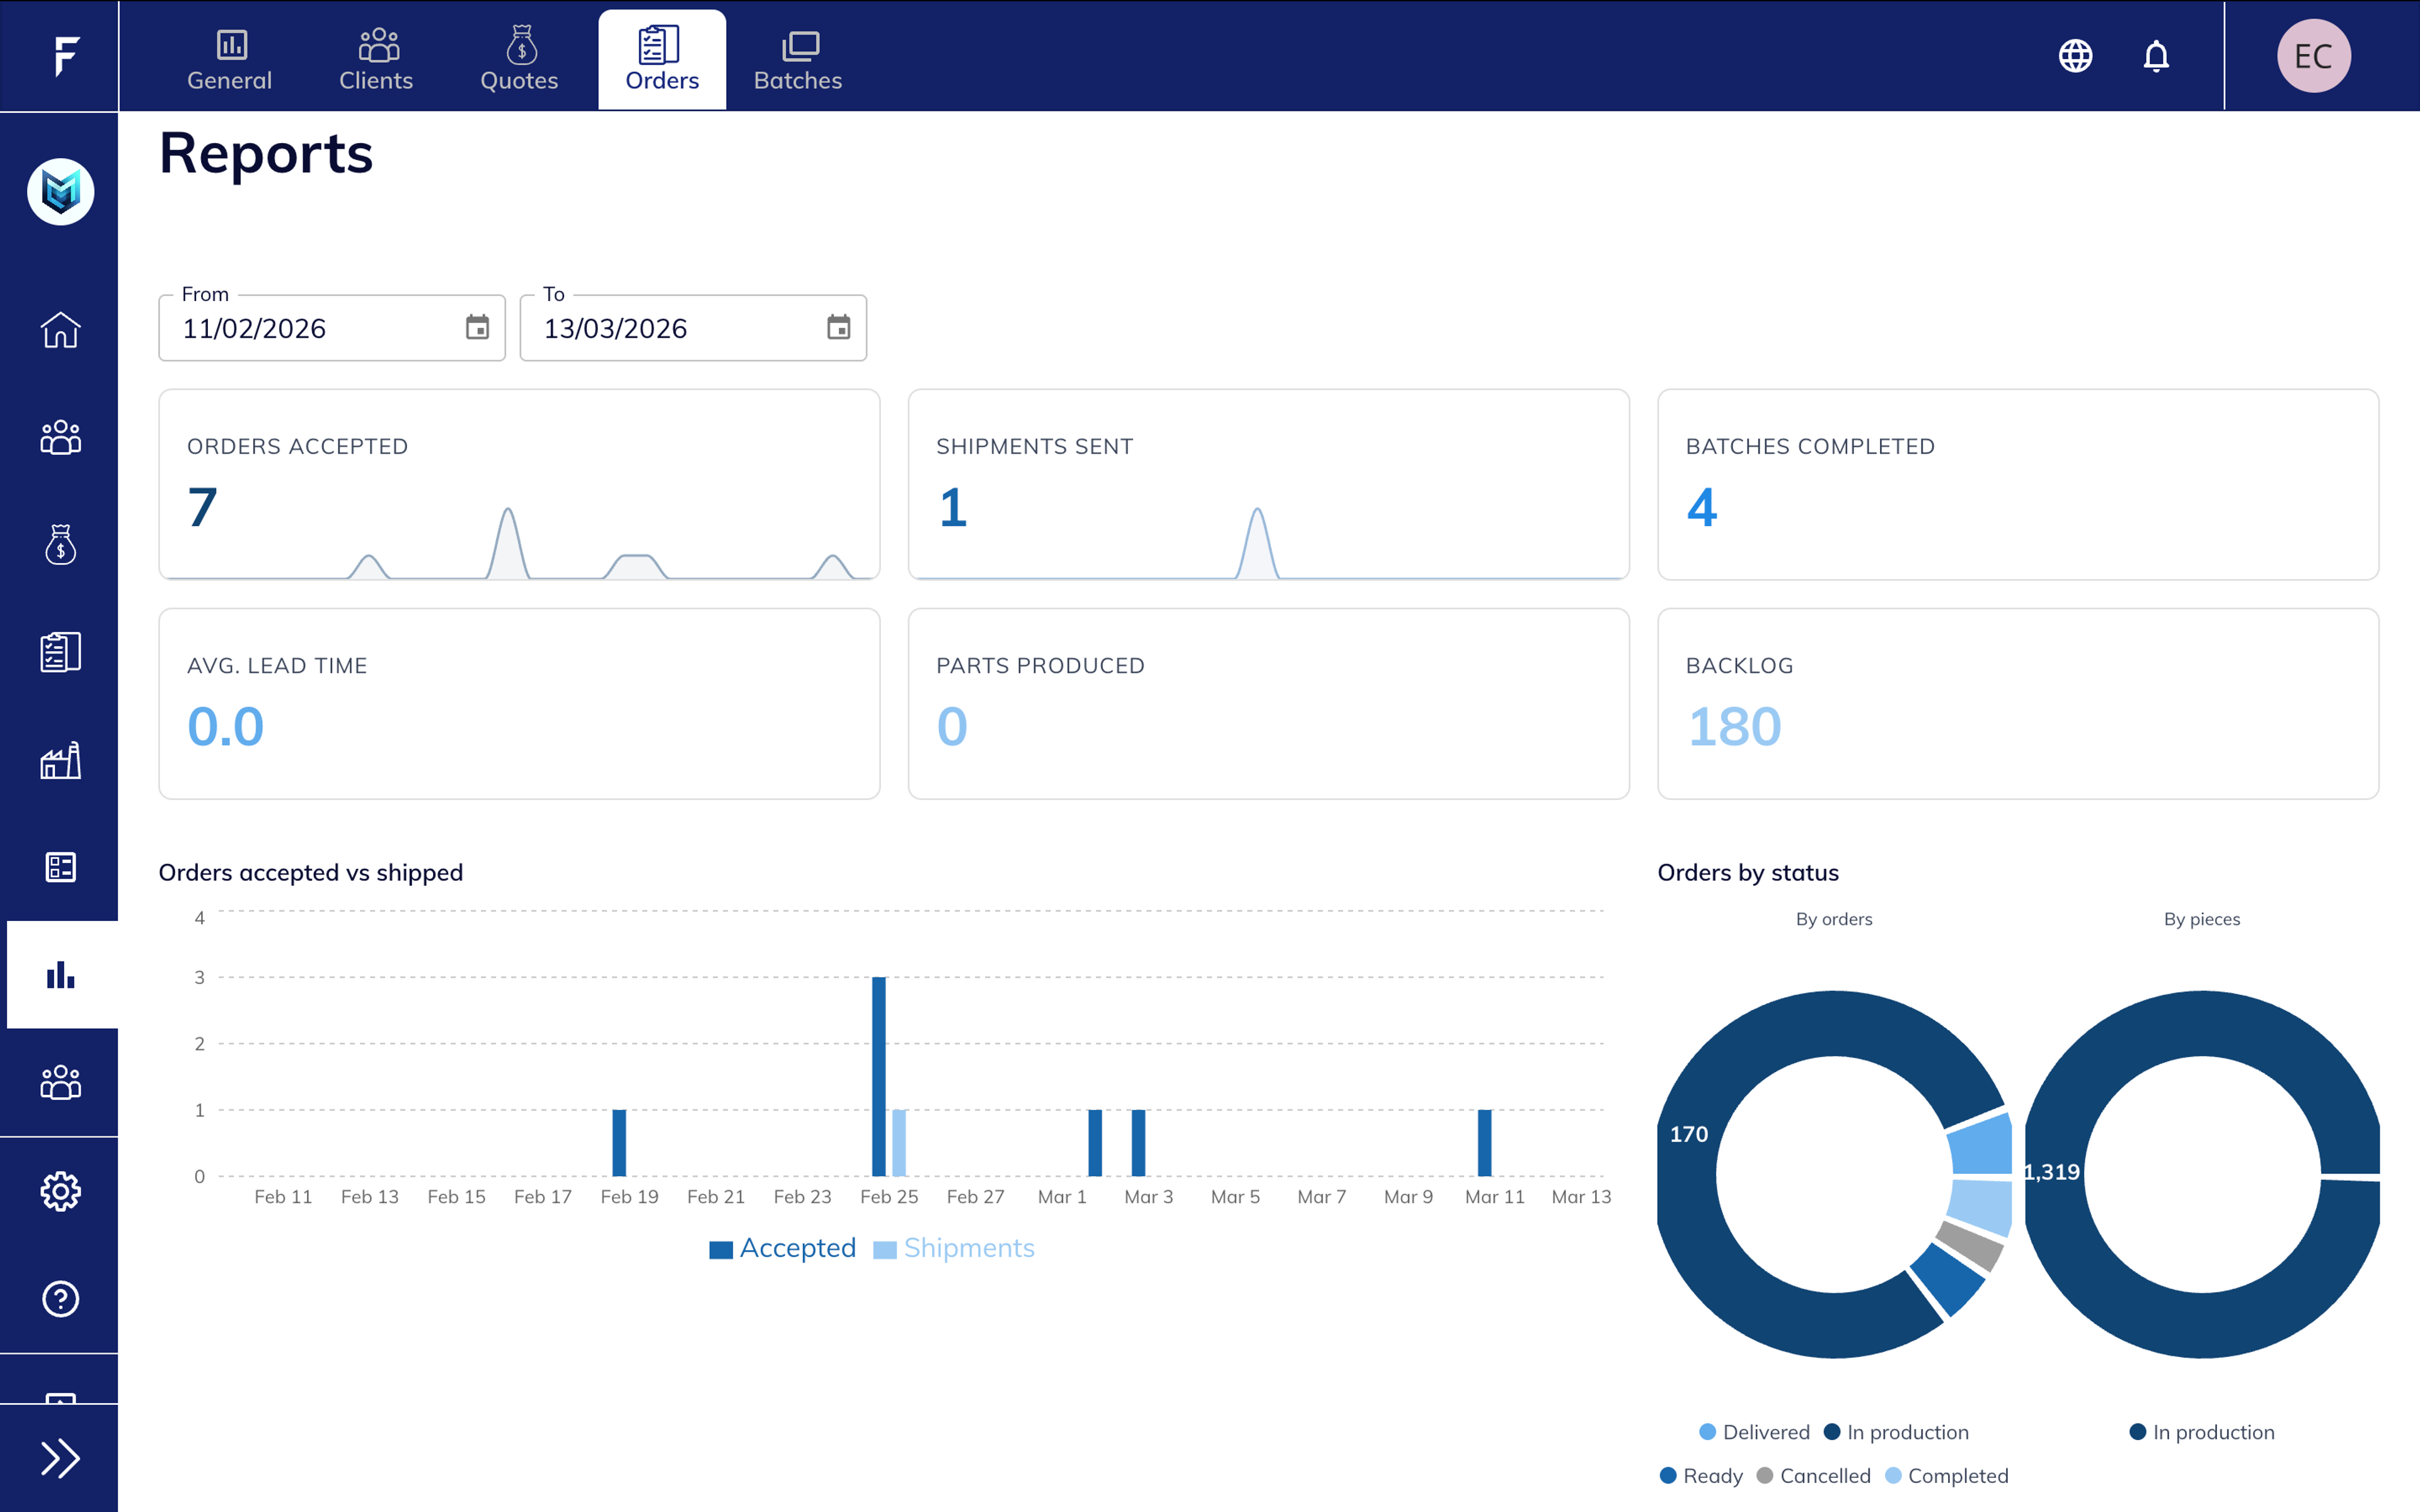
Order Fulfillment Tracking
The Orders report helps monitor order flow and fulfillment performance.
It provides visibility into orders accepted, shipments sent, batches completed, and backlog.
Status charts also help teams understand how orders are distributed across production stages.
Key metrics include:
- Orders accepted
- Shipments sent
- Batches completed
- Order backlog
- Order status distribution
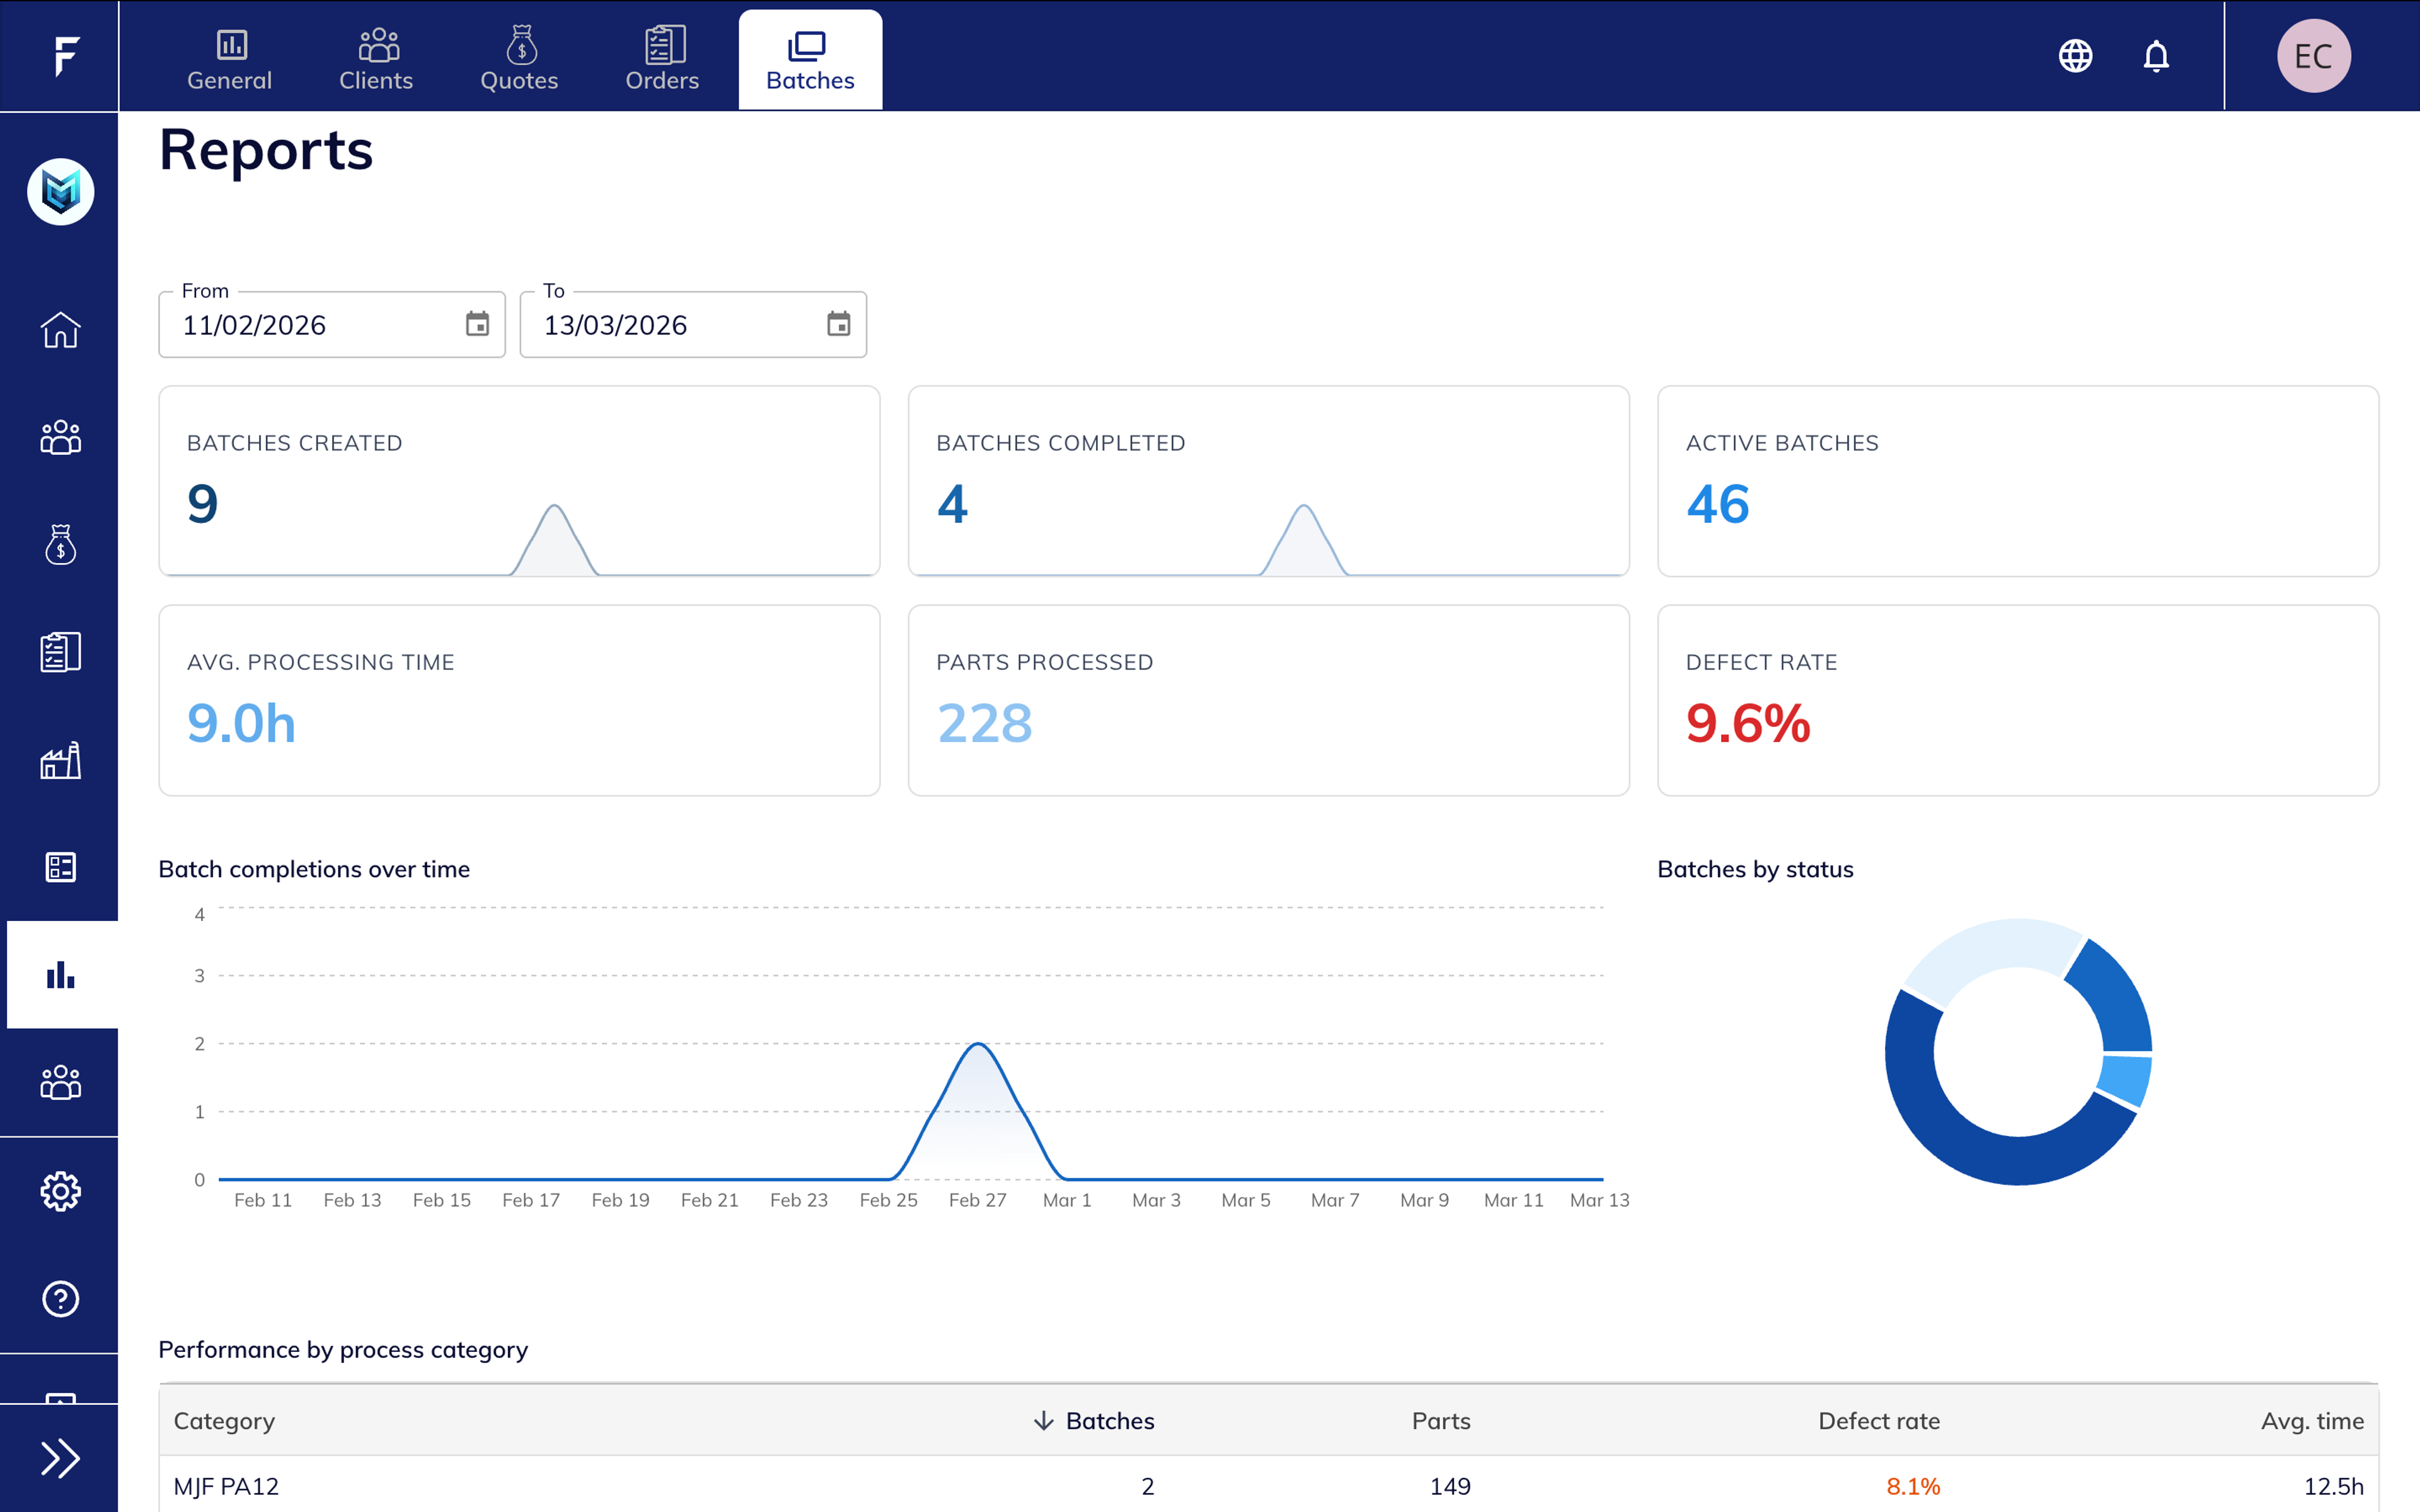
Production Performance Monitoring
The Batches report focuses on production efficiency and manufacturing performance.
It provides insight into batch throughput, processing times, and defect rates, helping teams monitor production quality and efficiency.
Additional charts show batch completion trends and production performance by process category.
Key metrics include:
- Batches created and completed
- Active batches
- Parts processed
- Average processing time
- Defect rate
Client Page Analytics
Client-Level Performance Overview
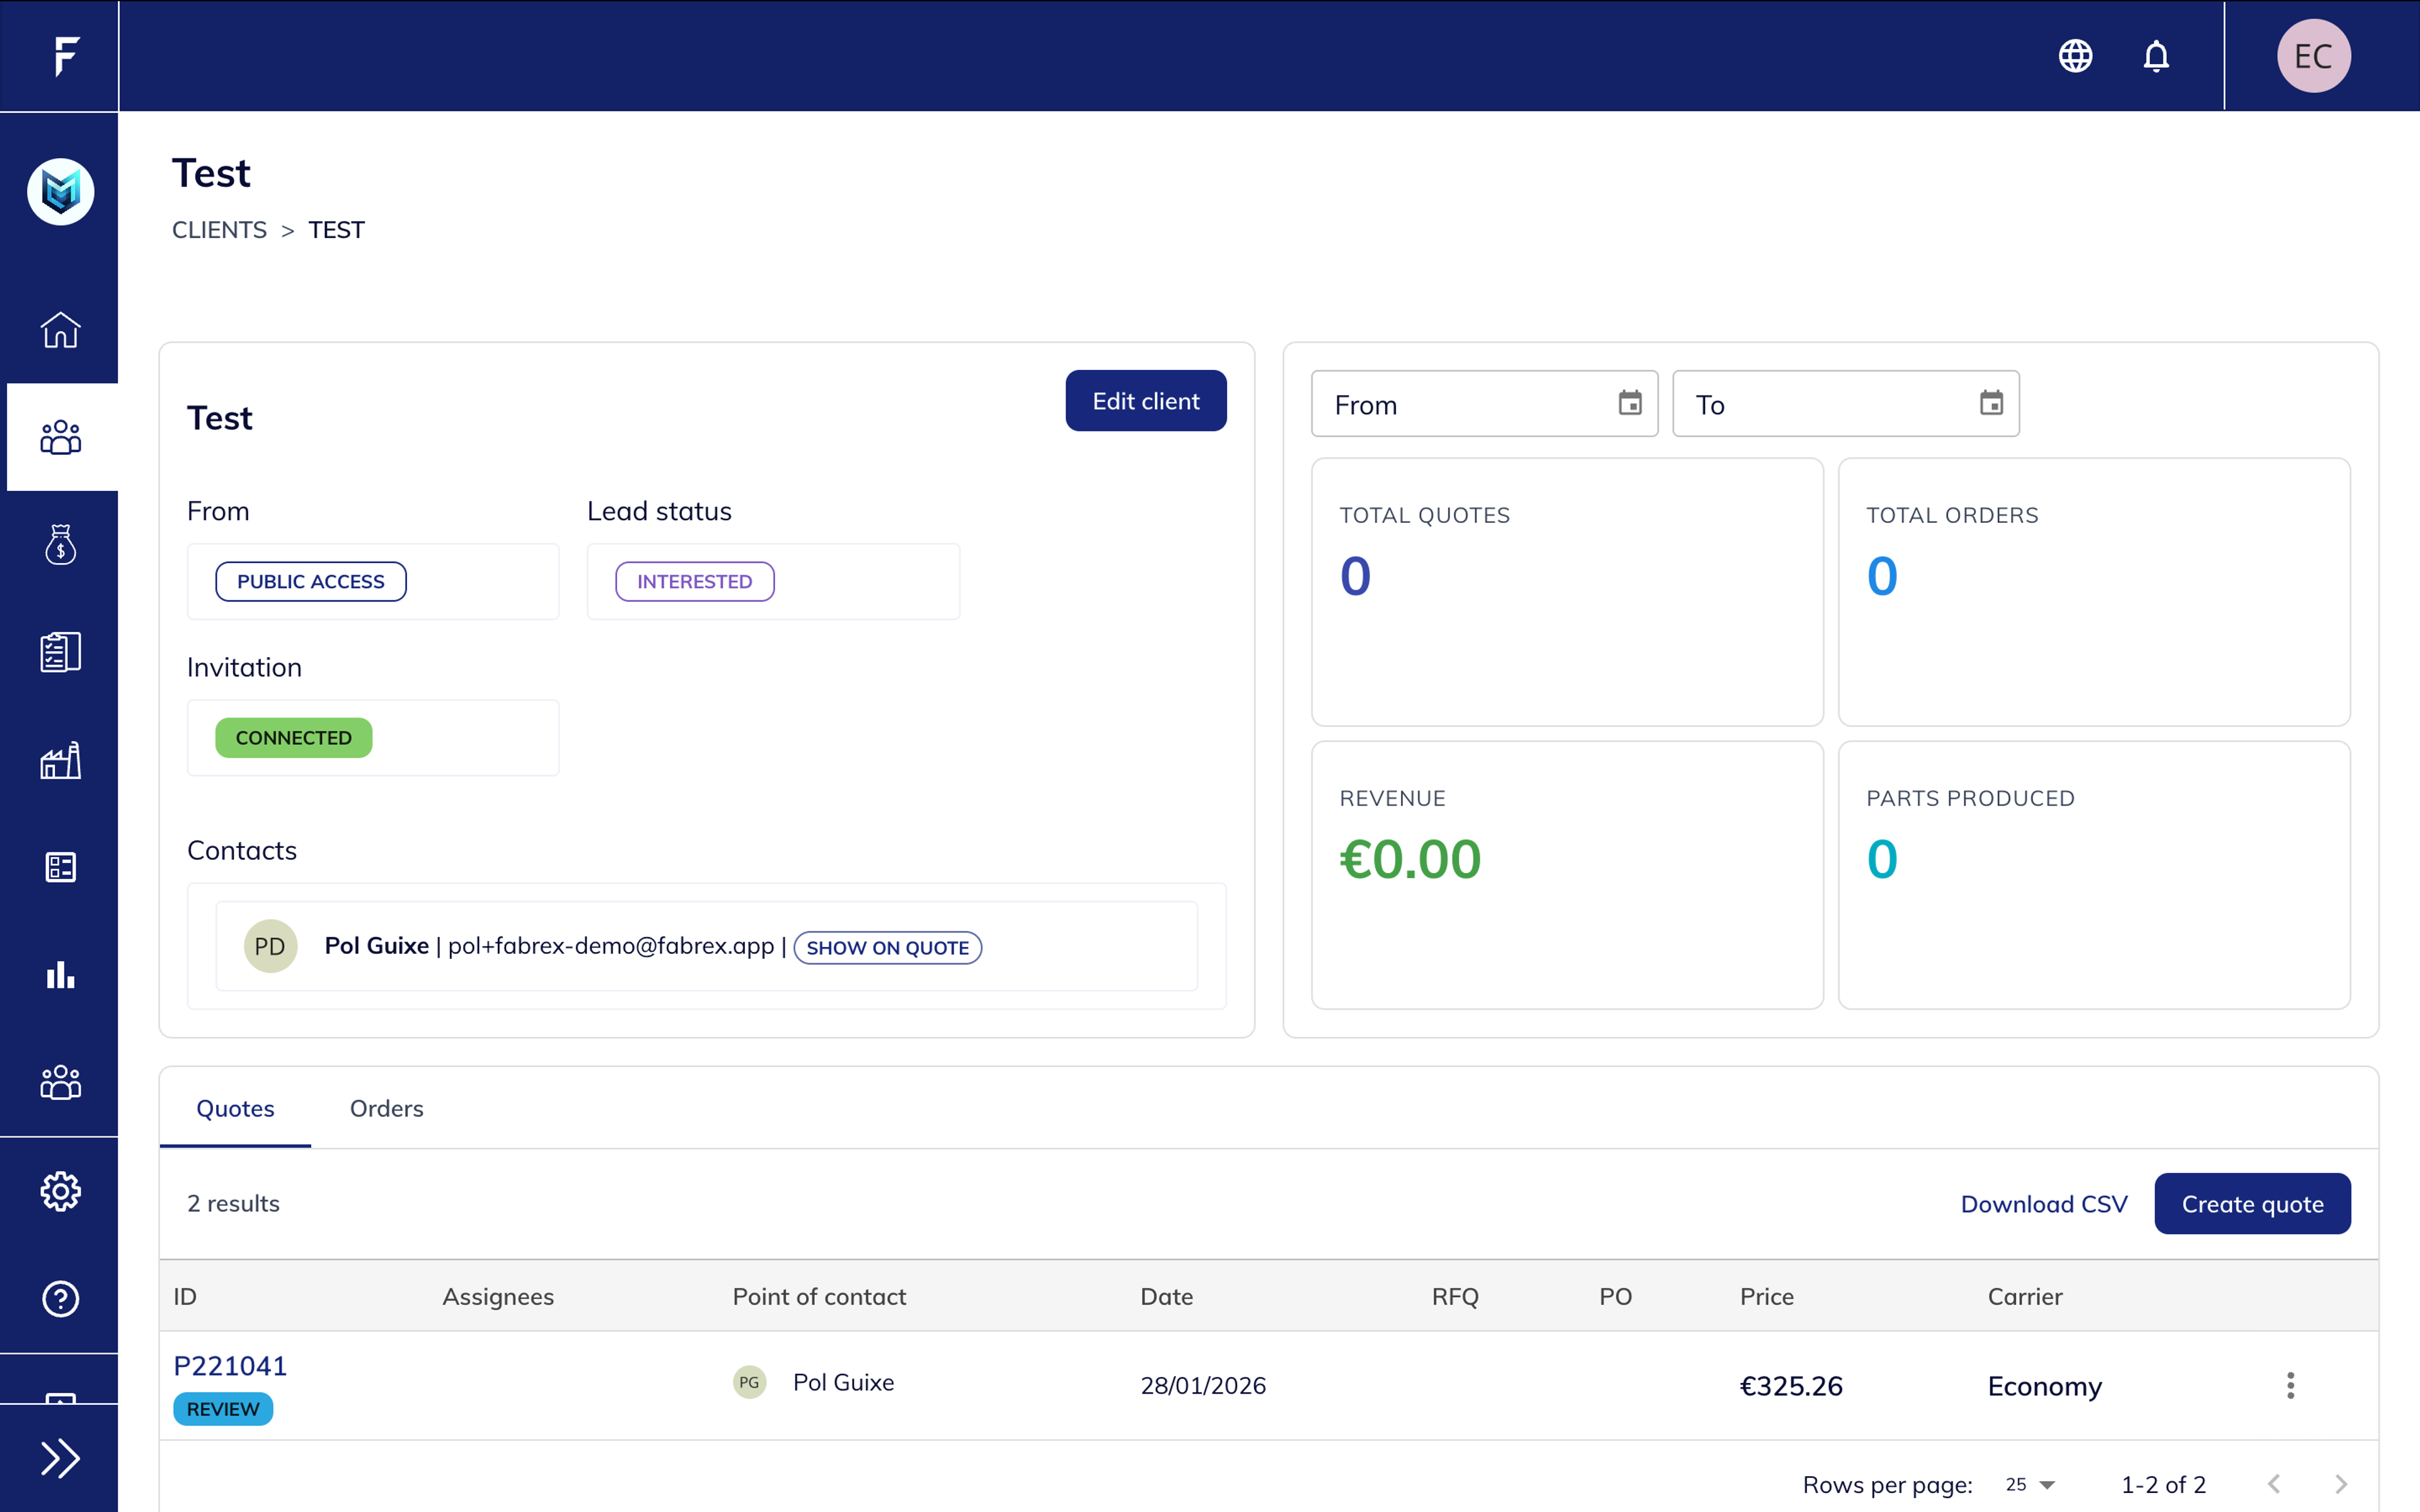
The client page now includes analytics widgets that summarize activity for each individual customer.
You can quickly see the number of quotes, orders, revenue generated, and parts produced for that specific client.
This makes it easier to understand client engagement and value without leaving the client profile.
Highlights include:
- Client revenue overview
- Quote and order activity
- Production metrics per client
- Integrated client contact and quote history
Better Visibility Across Your Operations
Operational Visibility
Clear insights into quotes, orders, batches, and production activity.

Client Intelligence
Understand customer activity, revenue contribution, and growth over time.

Performance Tracking
Monitor conversion rates, order flow, and production metrics.

Data-Driven Decisions
Access structured insights to guide operational and sales decisions.